Hepatocellular carcinoma (HCC) occurs in people with an underlying liver disease of either viral or toxic origin. It is usually preceded by cirrhosis. In the Czech Republic alcoholic liver disease is the major etiological factor. Tumor microenvironment is composed of myeloid (innate immunity) and lymphoid (adaptive immunity) lineages. Infiltrating immune cells can function to control tumor growth or to help create an immunosuppressive environment in which the tumor can thrive. The long suspected role for immune surveillance in human cancer has gained strong experimental support in the past decade. The concepts of ‘hot’ or ‘cold’ tumors refer to signs of inflammation (hot) when the tumor has already been infiltrated by T cells, which usually correlates with a response to immunotherapy. Even more gratifying, these scientific breakthroughs have also benefited clinical oncology in the context of diagnostics, prognostication, drug development and therapy.
For colorectal cancer, an “immunoscore” based on the quantification of two types of immune T cells (CD3+ and CD8+) in the tumor center and in the advancing tumor margin has turned out to be the best prognostic predictor for survival. Also for HCC similar immunoscores have been devised but the outcome has been less convincing.
Our hypothesis posits that the composition of the cellular landscape in the liver will reflect the degree of malignant progression from cirrhosis to fulminant HCC. To test this hypothesis we selected 70 primary HCC patient samples from archival FFPE tissues, identified slides showing distinct areas of tumor and cirrhotic or healthy liver, and stained immunohistochemically for 6 different cell types (11 cells types will be examined in total). We are scoring numerical cell densities in each patient in several regions of interest: healthy or cirrhotic liver, tumor center, inner and outer layers of tumor invasive margin and peritumoral area. Then we are going to compare quantitative abundance of particular cell types between different regions of interest, between samples with/without mutations in TERT promoter, TP53 and CTNNB1, and correlate numerical cell densities with patients’ demographic, pathological and clinical data.
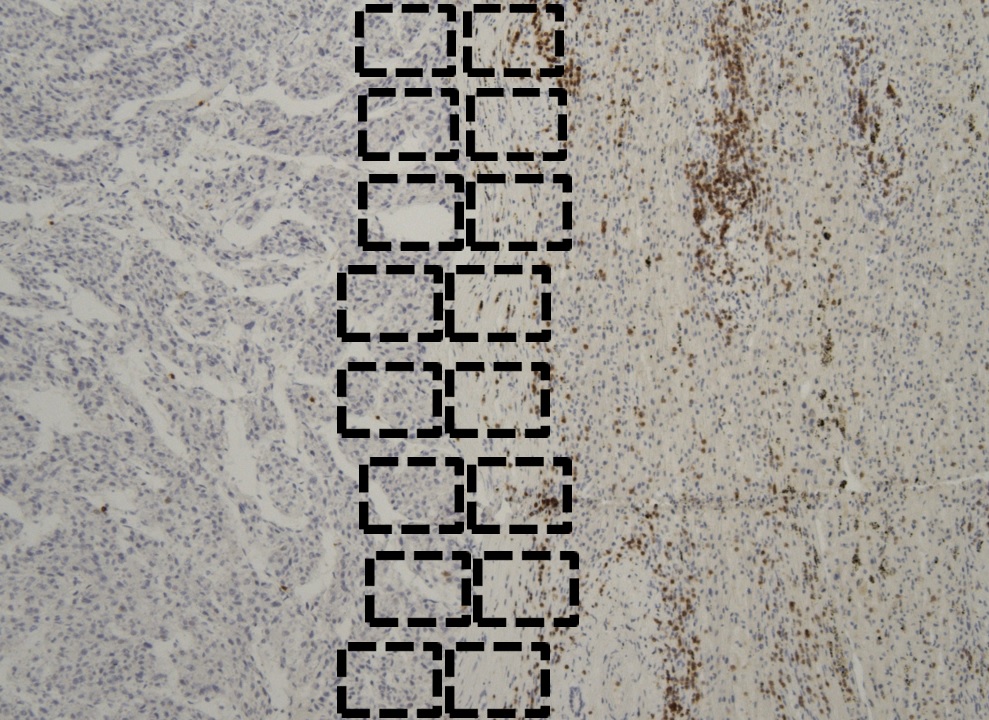
CD3-stained tissue. Example of sampling pattern in tumor invasive margin.
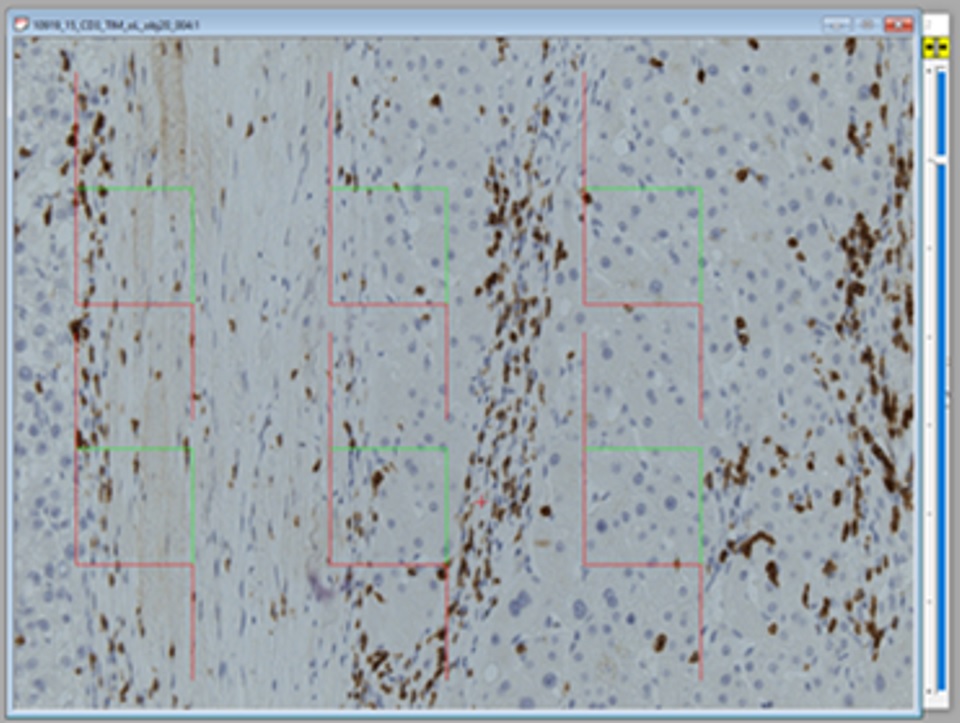
CD3-stained tissue. Example of stereological analysis using a 2D unbiased counting frames.